nginlog
2017 · 09 · 09

Nginlog is an nginx traffic analysis tool. I submitted nginlog as my final project for the 2017 Full Stack Web Development course at Portland State University.
Nginlog consists of two components. A server component logs HTTP requests, and a client application displays the data in charts and a map.
Server
The server component could be on any machine where nginx has been configured to log requests as JSON. A Python script reads the JSON log entries and inserts them into a CouchDB database. A set of views is defined on the data and served by CouchDB through nginx as a proxy. Requests the client makes to CouchDB are not logged.
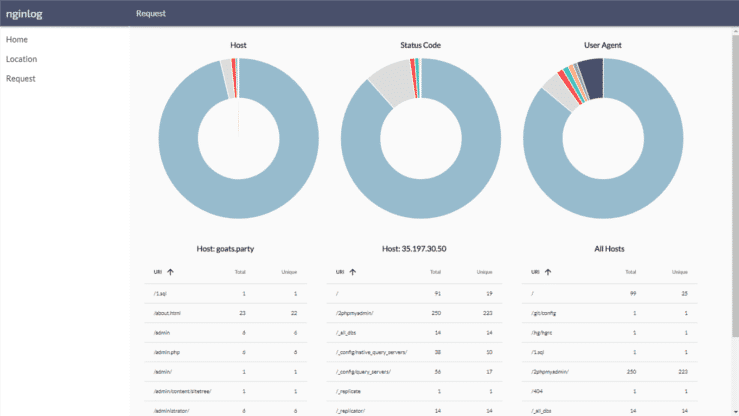
Client
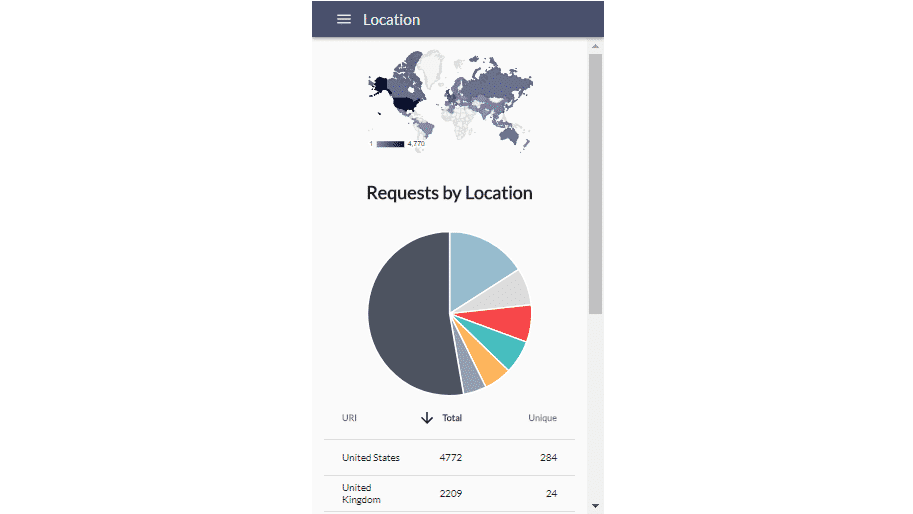
The client application uses the AngularJS framework, node as a server, Chart.js for charts, md-data-table for tables, and Google Charts for a map of requests by country.
The charts and tables display total and unique requests by country and host, as well as total requests by status code and user agent.
The client application is responsive to screen size. On a mobile device, the sidebar menu hides under a menu button and all visualizations resize or transform to fit neatly into a single column.
Utility
To use nginlog in a production setting, many improvements would be needed. The server component should require authentication for all requests of data. Users should be able to select time periods for each visualization, and search functionality should be added to all data tables.
The source code for nginlog is available on GitHub.